make CFLAGS="-O0 -g3"
Documentation
Development: Debugging Cherokee
cherokee-admin
Cherokee Admin is written in Python. While making changes, you can use the -x or --debug parameter to see the Python back traces in the active console.
cherokee
If you need to debug the behavior of the web server (or an application), there are some helpful tools available for you.
-
To start with, if you are using gcc and you want to compile Cherokee with debug information just execute make like this:
And then you’ll be able to execute gdb, cgdb, gdbtui..
-
You can use autoconf to set up Cherokee to use static modules:
  ./autogen.sh --localstatedir=/var --prefix=/usr --sysconfdir=/etc  \
  --with-wwwroot=/var/www --enable-static-module=all --enable-static \
  --enable-shared=no
-
If you want a code backtrace printed each time an error message is generated, add the following configure parameter:
--enable-backtraces
-
You can also enable a cool feature: the CHEROKEE_TRACE environment variable to trace what is going on inside the server. To enable it you must add a special flag to your configure or autogen.sh statement:
--enable-trace
This will let you trace the behavior with a human-readable output.
Note that by enabling tracing you will be making Cherokee a lot slower. Keep this in mind when deploying in production environments.
Now, when you are going to launch the web server, just add the CHEROKEE_TRACE variable, with the desired options:
Of course, you can trace all the modules (handlers, loggers..) you need:
CHEROKEE_TRACE="common,static,io_cache" /usr/bin/cherokee
CHEROKEE_TRACE="all" /usr/bin/cherokee
By default the environment variable contains a list of comma separated words, that point the server which parts and actions are interesting for your trace. Besides, there are a few special cases:
Keyword Description all
Activates all the trace points
time
Prints the time at the beginning of the line
thread
Prints the thread ID
from=<IP>
Restrict the tracing to the information generated by certain IP or Subnet.
-
You can also access the functionality of CHEROKEE_TRACE through cherokee-tweak. Refer to the apropriate section of the documentation to learn more about this: cherokee-tweak.
-
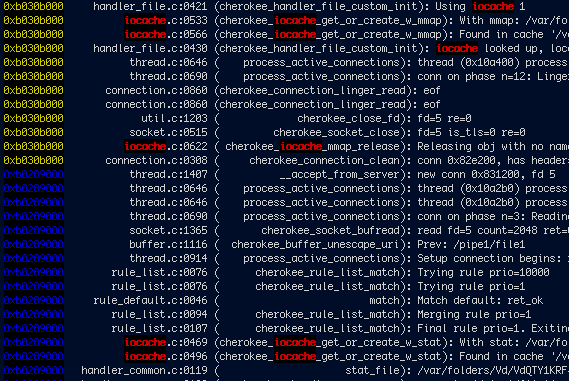
Lastly a utility is provided, contrib/tracelor.py, to provide further help to these tracing abilities. It is a little script that helps to read the tracing logs by colorizing the thread references and highlighting the words passed through the command line.
An example of usage would be:
CHEROKEE_TRACE=thread,all ./cherokee | ../contrib/tracelor.py iocache
And it would yield a colorized output. Even if it is not terribly complicated, it is a handy script to trace the server more easily.